Vaccines Did Not Save Us – 2 Centuries Of Official Statistics
Original Source: Child Health Safety
This is the data the drug industry do not want you to see. Here 2 centuries of UK, USA and Australian official death statistics show conclusively and scientifically modern medicine is not responsible for and played little part in substantially improved life expectancy and survival from disease in western economies.
A detailed Contents listing of this article with each category of disease and related graphs appears after the Introduction.
Introduction
The main advances in combating disease over 200 years have been better food and clean drinking water. Improved sanitation, less overcrowded and better living conditions also contribute. This is also borne out in published peer reviewed research:
- “The questionable contribution of medical measures to the decline of mortality in the United States in the twentieth century“. McKinlay JB, McKinlay SM, Milbank Mem Fund Q Health Soc. 1977 Summer; 55(3): 405-28.
- “Symposium: Accomplishments in Child Nutrition during the 20th Century. Infant Mortality in the 20th Century, Dramatic but Uneven Progress” Myron E. Wegman School of Public Health, University of Michigan: J. Nutr. 131: 401S–408S, 2001.
In addition to the extensive static graphs below, the following superb BBC FOUR broadcast by Professor Hans Rosling shows how health improved in step with wealth over the last 200 years “200 countries over 200 years using 120,000 numbers – in just four minutes“:
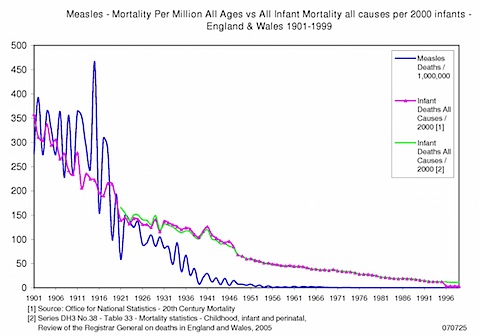
Measles mortality graphs are enlightening [more below] and contradict the claims of Government health officials that vaccines have saved millions of lives. It is an unscientific claim which the data show is untrue. Here you will also learn why vaccinations like mumps and rubella for children are medically unethical and can expose medical professionals to liability for criminal proceedings and civil damages for administering them.
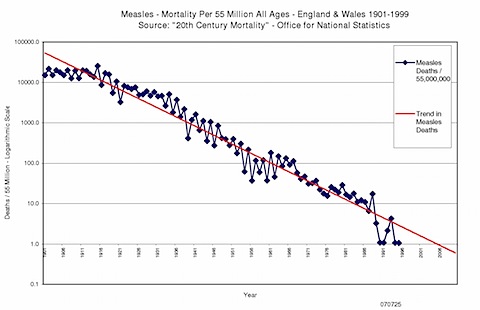
(larger image: https://childhealthsafety.files.wordpress.com/2009/01/0707275measleslog.jpg)
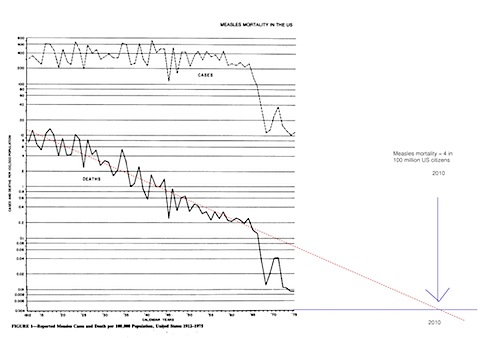
(larger image: https://childhealthsafety.files.wordpress.com/2009/01/measlesmortalityusa1971-75_1.jpg)
The success of the City of Leicester, England was remarkable in reducing smallpox mortality substantially compared to the rest of England and other countries by abandoning vaccination between 1882 and 1908 [see more below].
This contrasts how the drug industry has turned each child in the world into a human pin-cushion profit centre.
You might think the following graph is some support for the success of diphtheria vaccination [see blue line]: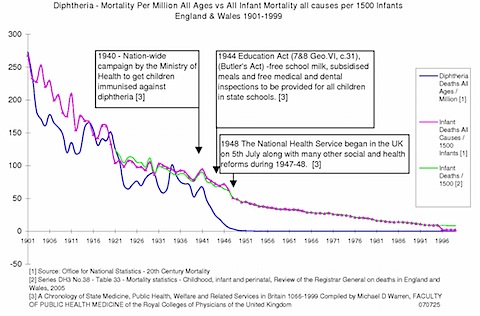
(larger image: https://childhealthsafety.files.wordpress.com/2009/01/0707277diphtheria.jpg)
Notice how overall infant mortality was unaffected [green and purple lines]. And two official sources of data have been used to ensure there is no doubt. Records show most children went unvaccinated until well after the major fall. At least half the children under 10 years of age had not been vaccinated prior to 1946. The fall could not be attributable to vaccine “herd immunity” [for diphtheria this is claimed to require 80-85% vaccine coverage: Herd immunity-concepts of control UK Health Protection Agency].
To account for the fall in diphtheria mortality [blue graph line] one must look elsewhere for the cause.
The vaccination campaign was launched at the end of 1940 but got underway in 1941. By the end of 1941 “36 percent of school age children had been immunised but only about 19 percent of the younger children“: British Journal of Nursing October 1948 p121. It was only after the large fall, that in 1946-47 there was a “catch-up” diphtheria vaccination campaign. 969,000 children under 5 years of age were vaccinated and 272,000 children aged 5-15. The total of 1,241,000 was nearly one third greater than the total number of children born in the 7 years 1938-1945, [which was 956,724 births]: Recent trends in the incidence of multiple births and associated mortality Archives of Disease in Childhood, 1987, 62, 941-950.
So what could account for this seemingly dramatic fall? The introduction of free school milk [eg. vitamin A etc], subsidised meals and free medical inspections for all children in state education need to be considered as the most likely and most serious contenders in the light of our knowledge about the effect of improved nutrition on health.
So what this also of course means is that health officials promote vaccination against diphtheria when the vaccination appears most unlikely as a cause of the decline in diphtheria. This also means that medical knowledge about basic diseases is seriously flawed and has not advanced in this respect since at least 1940. This is an issue of who knows best? This information suggests doctors and health officials do not seem to know at all.
If you are angry and feel you have been lied to, you are justified. But there is worse.
Do vaccines cause autistic conditions? If you read nothing else we strongly recommend you read this: PDF Download – Text of May 5th 2008 email from US HRSA to Sharyl Attkisson of CBS News]. In it the US Health Resources Services Administration [HRSA] state to CBS News reporter Sharyl Attkisson in response to her question about how many cases had been compensated by the US government in which a vaccine-injured child developed autistic symptoms:
We have compensated cases in which children exhibited an encephalopathy, or general brain disease. Encephalopathy may be accompanied by a medical progression of an array of symptoms including autistic behavior, autism, or seizures.”
Despite all the lies and deceit by health official worldwide, the question “do vaccines cause autism” was answered after the Hannah Poling story broke in the USA in February 2008 [see CHS article here]. Hannah developed an autistic condition after 9 vaccines administered the same day. Under the media spotlight numerous US health officials and agencies conceded on broadcast US nationwide TV news from CBS and CNN. Full details with links to the original sources can be found in this CHS article: Vaccination Causes Autism – Say US Government & Merck’s Director of Vaccines. [Blue Text added 10 April 2011]
The financial markets have known for 20 years and more the pharmaceutical industry’s blockbuster patented drugs business model would eventualy fail. We now see the Bill Gates’ type business model emerging – almost everyone has Windows software on their PC – almost everyone will be vax’ed. Gates quickly became a multi-billionaire. With vastly more people to vaccinate than computers requiring software the lure of money is many times greater. All this whilst we watch as childhood prevalence of asthma, allergies, autism, diabetes and more have increased exponentially as the vaccines have been introduced.
Can “vaccinatable” diseases “return” despite vaccination? Yes. If you are too poorly nourished your body is likely to lack essential nutrients needed to maintain its immune system sufficiently to withstand disease. This will happen regardless of how many vaccinations you have had. This was experienced in Eastern Europe following the collapse of the old Soviet Bloc and the economic chaos which ensued, leaving many in great poverty.
For the same reason vaccines do not “work” and “save” lives in impoverished African and other third world economies. The majority of third world child deaths still occur despite vaccination. These children need proper food, clean water to drink and wash in and sanitation. We give them vaccines instead.
These third world children die because we have vaccines. In the 21st Century, despite all the claims made about modern science, we have no effective treatments for common basic childhood diseases.
It has been estimated vaccines prevent 25% of the deaths of these children, so 75% still die. If there were effective treatments we could save their lives.
We have no effective treatments because there is no incentive for the drug industry and every incentive for them not to develop them. The World Health Organisation and our health departments worldwide, in thrall to and under the influence of the drug industry, do nothing about it.
Something could be done. This needs political commitment from western developed nations and the courage to stand up against vested commercial interests to develop effective treatments to save lives – children’s lives.
And when you read the vaccine movement blogs claiming those concerned with vaccine safety are acting out irrational unfounded unscientific fears, remember the highly specific factual referenced reasoned justified information provided on just this one site, among many others. Also ask yourself, how often do government agencies and officials lie publicly about pretty much anything. And notice how bloggers attack, disparage, bully abuse and harass those who express concerns about vaccines, leaving government officials and drug industry spokespeople able to hide silently behind the barrages of abuse and misinformation. Some of these anonymous individuals are commenting full time daily across numerous blogs and news sites across the internet but deny they are paid. Some appear to be awake 24 hours a day. Odd that. One we counted had made 200 comments in 10 days to April 22 2014. That was on just a selection of sample sites and did not include all that anonymous commenter’s activity.
[ED Note 15 Oct 2009: As information like that here has become available health officials are changing from scaremongering parents into vaccinating with claims their child could die. Now they claim vaccinating reduces the numbers of cases of disease [ie. instead of deaths] and produce graphs of dramatic falls in reported cases (instead of deaths) when measles vaccine was introduced.
This is again misleading. A dramatic fall in the numbers of reported measles cases would be expected. Doctors substantially overdiagnose measles cases especially when they believe it is a possible diagnosis.Doctors were told the vaccine prevented children getting measles when introduced in the late 1960’s so after that time a substantial reduction in diagnoses would be expected.
Examples of recent overdiagnoses of measles when there are measles “scares” are proportionately up to 74 times (or 7400% overdiagnosed). Figures and sources follow the next paragraph.
What health officials are also doing is relying on very old and unreliable data which ignores that measles has become progressively milder so the risks of long term injury have diminished – (and death is the most extreme form of long term injury – shown here by official data to have diminished rapidly and substantially over the past 100 years without the risks posed to children’s health by vaccines).
Measles Over Diagnosed – Up to 7400%
A. Laboratory confirmed cases of measles, mumps, and rubella, England and Wales: October to December 2004
Notified: 474, Tested: 589†, Confirmed cases: 8
RATE OF OVERDIAGNOSIS:- 589/8 = proportionately 7400% or 74 times overdiagnosed
SOURCE: CDR Weekly, Volume 15 Number 12 Published: 24 March 2005
[Note from Source: “†Some oral fluid specimens were submitted early from suspected cases and may not have been subsequently notified, thus the proportion tested is artificially high for this quarter.”]
B. Total confirmed cases of measles and oral fluid IgM antibody tests in cases notified to ONS*: weeks 40-52/2005
Notified: 408, Tested: 343, Confirmed cases: 22
RATE OF OVERDIAGNOSIS:- 343/22 = proportionately 1560 % or 15.6 times overdiagnosed
SOURCE: CDR Weekly, Volume 16 Number 12 Published on: 23 March 2006Contents
Typhoid & Scarlet Fever – Mortality UK, USA & Australia
Mumps Mortality – England & Wales
Rubella Mortality – England and Wales
Mortality, Life Expectancy, Healthcare Costs UK, USA and Worldwide
Disease Mortality UK, USA & Australia
Diphtheria Mortality – England, USA & Australia
Whooping Cough (Pertussis) Mortality Rates – UK, USA & Australia
Tetanus Mortality – England & Wales 1901 to 1999
Smallpox Mortality – UK, USA & Sweden
Leicester & Smallpox
Extracts From “Leicester: Sanitation Versus Vaccination” by J.T. Biggs J.P.
Table 21. – Smallpox Fatality Rates Compared with “Unprotected” Leicester – 1860 to 1908.
Table 29. Small-pox Epidemics – Cost and Fatality Rates Compared
Scurvy Mortality Rates
To start you with something simple, Scurvy, Typhoid and Scarlet Fever are good examples to use as comparisons with “vaccinatable” diseases.
(larger image: https://childhealthsafety.files.wordpress.com/2009/01/uk-scurvy-1901-1967.gif)
Medicine and especially drugs and vaccines played no part in the fall in Scurvy death rates and the same can be seen for other diseases. Scurvy is a condition caused by a lack of vitamin C. Poor nutrition, particularly a lack of fresh fruit and vegetables, can result in Scurvy. Mortality rates fell dramatically as living conditions improved.
Typhoid & Scarlet Fever - Mortality UK, USA & Australia
Typhoid and Scarlet Fever vanished without vaccines but with clean water, better nutrition, sanitation and living conditions.
(larger image: https://childhealthsafety.files.wordpress.com/2009/01/us-uk-typhoid-1901-1965.gif)
(large image: https://childhealthsafety.files.wordpress.com/2009/01/us-uk-scarlet-1901-1965.gif)
(Australia Typhoid Mortality Rates 1910 to 1970)
[SOURCE: Data – Official Year Books of the Commonwealth of Australia, as reproduced in Greg Beattie’s book “Vaccination A Parent’s Dilemma“ ]
(Australia Scarlet Fever Mortality Rates 1900 to 1970)
[SOURCE: Data – Official Year Books of the Commonwealth of Australia, as reproduced in Greg Beattie’s book “Vaccination A Parent’s Dilemma“ ]
MEASLES MORTALITY IN UK AND USA
By 2007 the chance of anyone in England and Wales dying of measles if no one were vaccinated was less than 1 in 55 million. The chance of being struck by lightning is 30 to 60 times higher: Tornado & Storm Research Organisation

(larger image: https://childhealthsafety.files.wordpress.com/2009/01/0707275measleslog.jpg)
Note that what seem large fluctuations after MMR vaccination was introduced in 1988 are not so large and are a feature of plotting the graph on a logarithmic scale. This can be seen in the following graph, plotted on an analog scale.
Continue Reading here: https://childhealthsafety.wordpress.com/graphs/